Introduction
In this guide, we will break down the engineering behind Dotify, a web application that transforms standard imagery into stylized dot matrix patterns inspired by the “Nothing” design language.
The Transformation
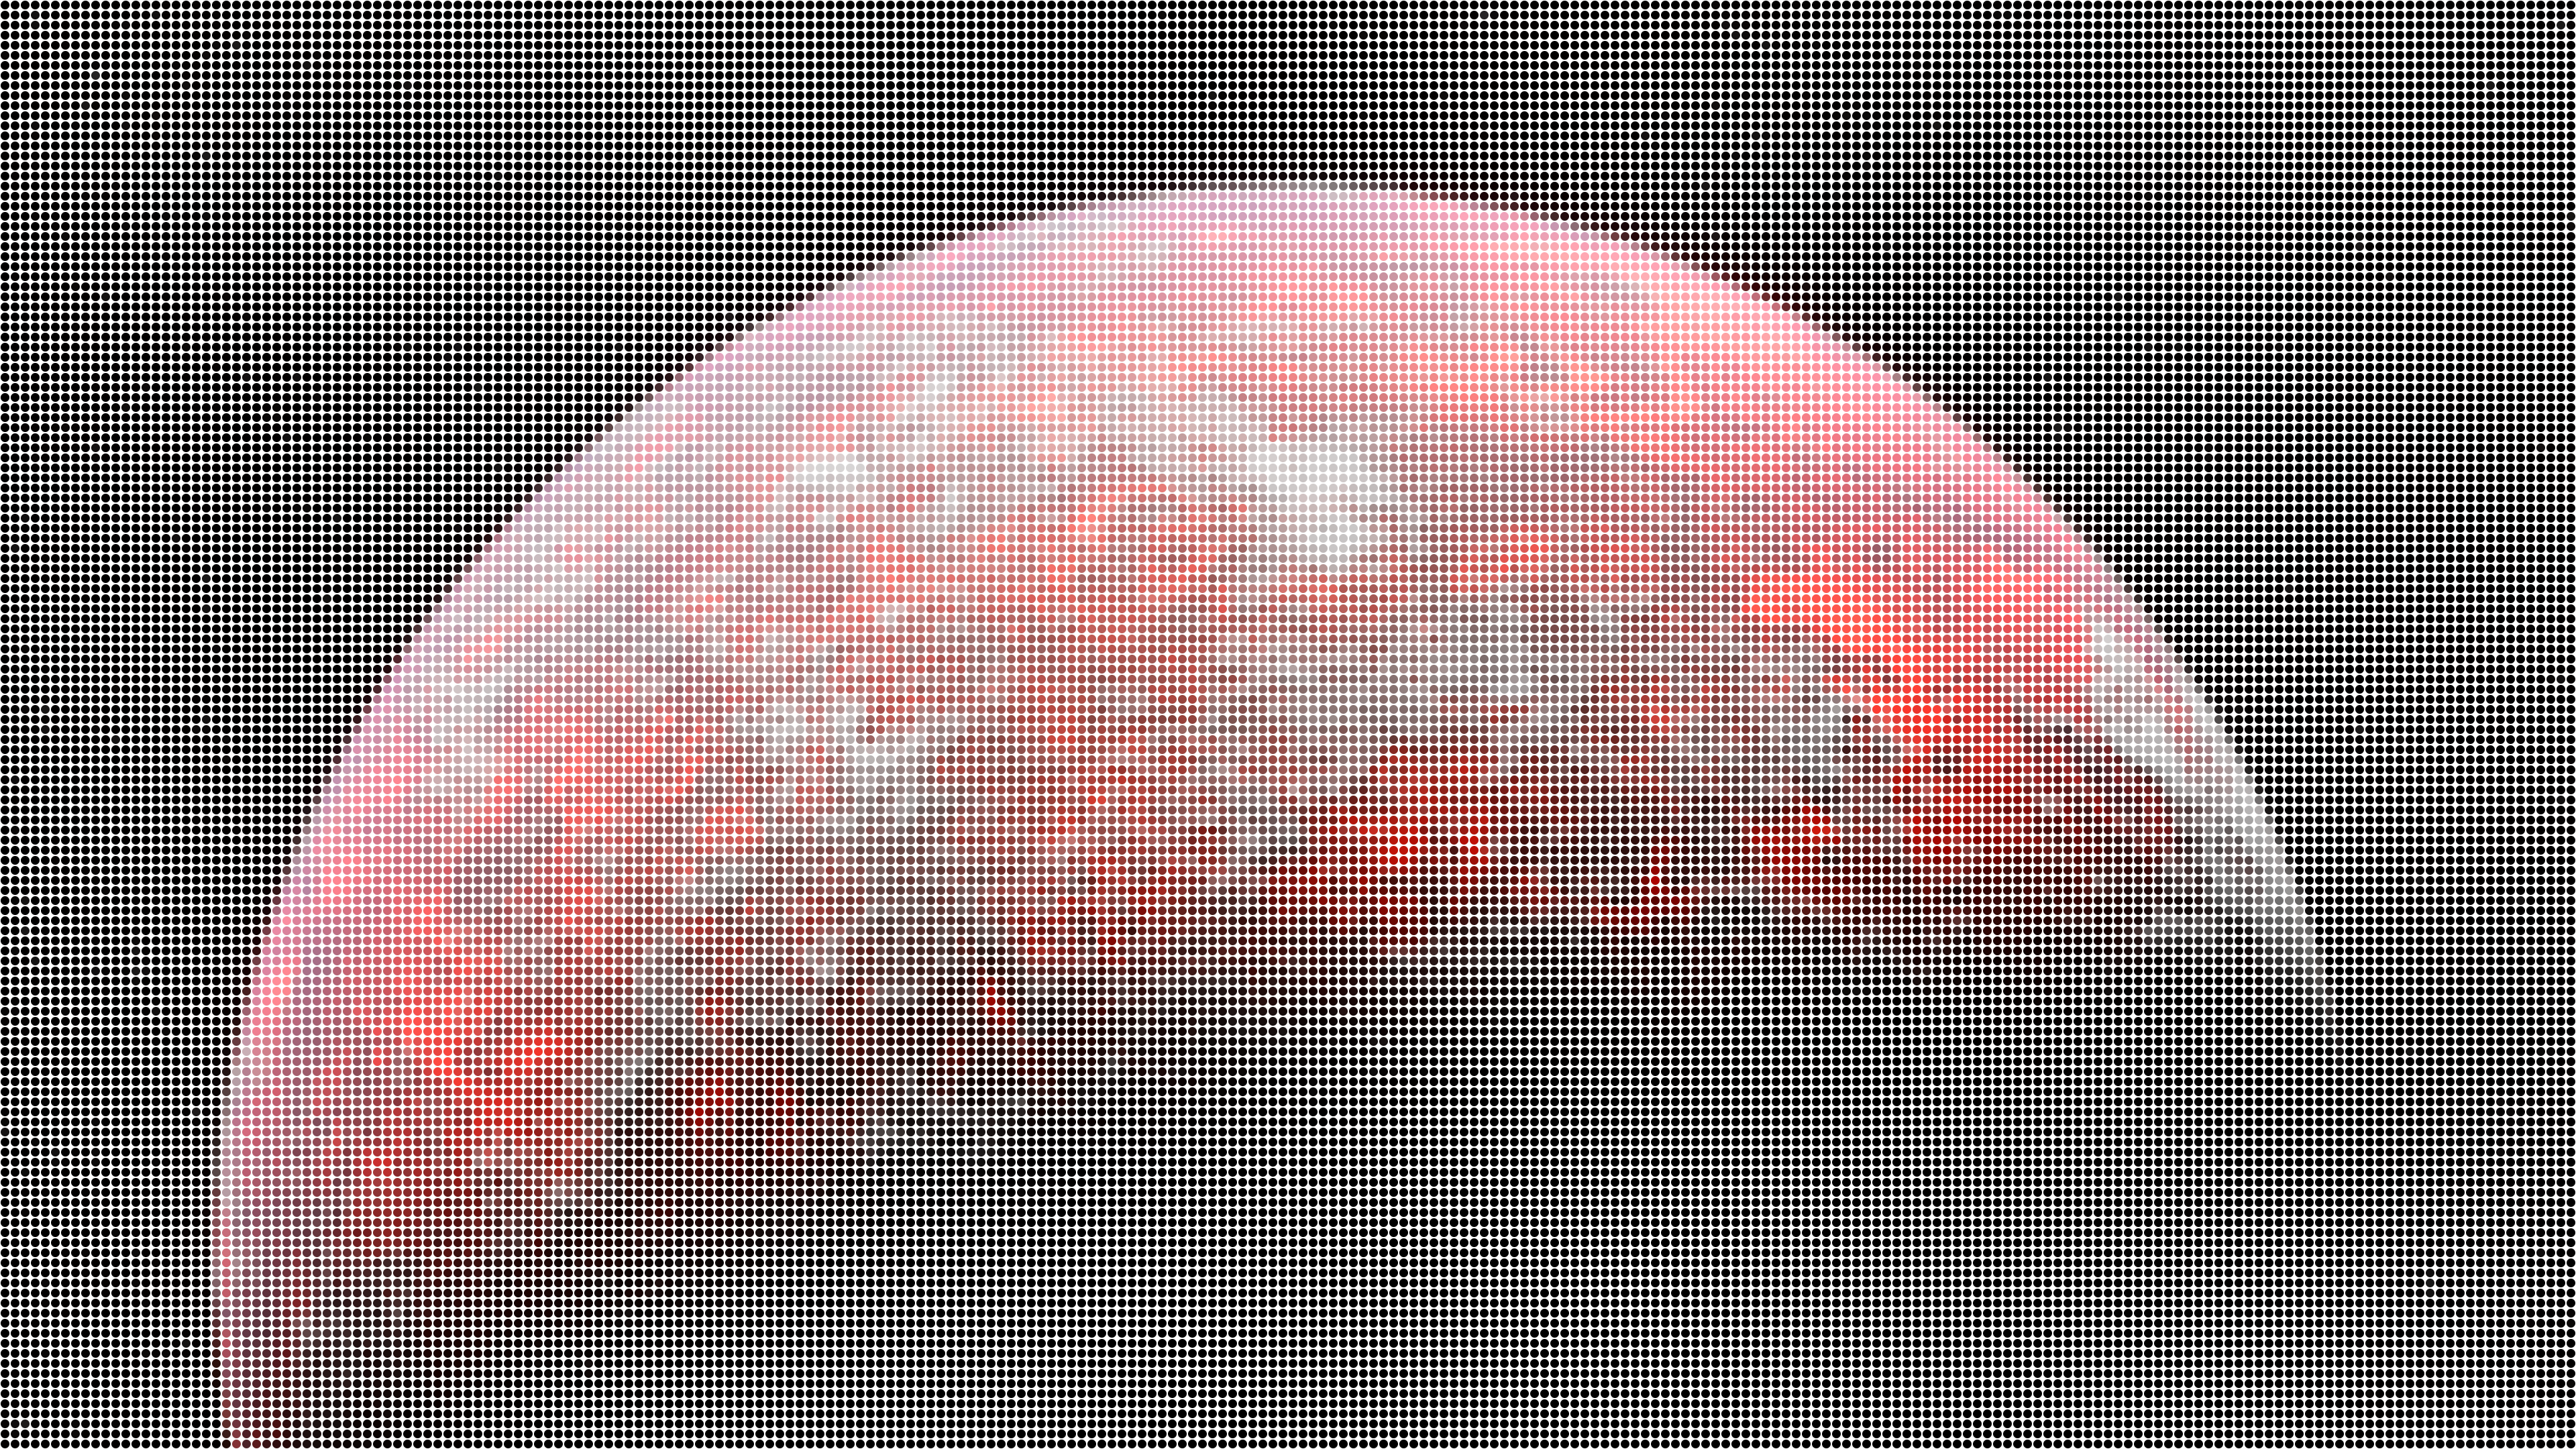
The concept is straightforward: we take a raster image and re-interpret it as a grid of discrete, color-sampled circles.
It takes a simple image like this one:
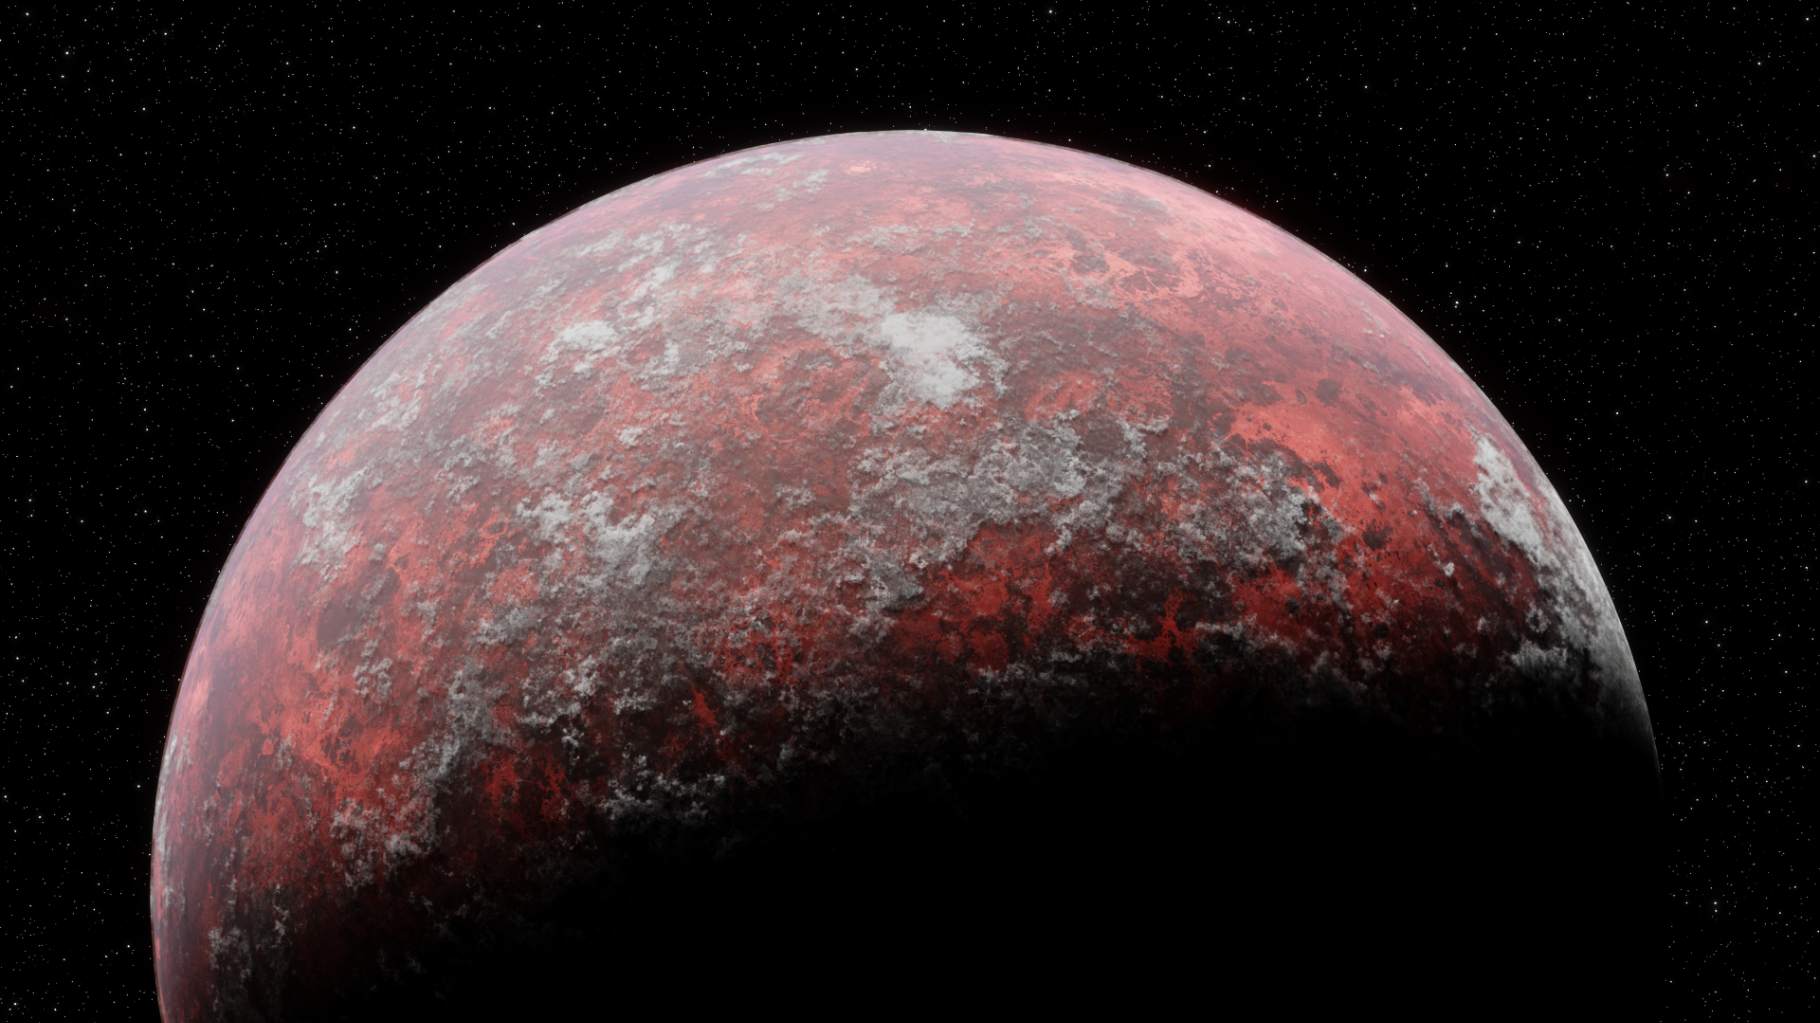
And transforms it into this:
Technical Stack
The architecture is built for speed and a seamless developer experience:
| Technology | Purpose |
|---|---|
| Next.js | Framework (App Router/Pages Router) |
| Tailwind CSS | Styling |
| ShadCN/UI | UI Components |
| Bun | Runtime/Package Manager |
1. Project Initialization
Initialize the project and install the core UI primitives.
# Create the Next.js application
bunx create-next-app@latest dotify-client

# Initialize shadcn/ui
bunx shadcn@latest init

# Install necessary UI primitives
bunx shadcn@latest add button checkbox input label select slider sonner
2. The Core Algorithm: Image Processing
The heart of the application lies in how we manipulate the HTML5 Canvas. We don’t just “blur” the image; we downsample it into a mathematical grid.
The Mathematical Model
To convert an image of width \(W\) and height \(H\) into a dot matrix, we define a grid size \(G\). The number of horizontal cells \(C_x\) and vertical cells \(C_y\) is determined by:
$$C_x = \left\lfloor \frac{W}{G} \right\rfloor, \quad C_y = \left\lfloor \frac{H}{G} \right\rfloor$$For each cell \((i, j)\), we must calculate the Average Color \(\bar{C}\_{i,j}\). If a cell contains \(n\) pixels, the average red component is:
$$\bar{R} = \frac{1}{n} \sum_{k=1}^{n} R_k$$The same formula applies for \(\bar{G}\), \(\bar{B}\), and \(\bar{A}\) (alpha) components.
Finally, the radius of the drawn circle \(r\) is calculated using the user-defined padding \(P\):
$$r = \frac{G - P}{2}$$The center coordinates of each circle in cell \((i, j)\) are:
$$x_{center} = i \cdot G + \frac{G}{2}, \quad y_{center} = j \cdot G + \frac{G}{2}$$Implementation: Grid Processing
We iterate through the image data in steps of gridSize. The imageData.data object provides a Uint8ClampedArray where pixels are stored as [R, G, B, A].
for (let y = 0; y < height; y += gridSize) {
	for (let x = 0; x < width; x += gridSize) {
		const gridPixels = [];
		// Extract pixel data for the current grid cell
		for (let gy = 0; gy < gridSize; gy++) {
			for (let gx = 0; gx < gridSize; gx++) {
				const pixelIndex = ((y + gy) * width + (x + gx)) * 4;
				if (pixelIndex < imageData.data.length) {
					gridPixels.push(
						imageData.data[pixelIndex], // R
						imageData.data[pixelIndex + 1], // G
						imageData.data[pixelIndex + 2], // B
						imageData.data[pixelIndex + 3], // A
					);
				}
			}
		}
		// Calculate average and render circle...
	}
}
Average Color Calculation
The function iterates through all pixels in a grid cell, summing their RGBA values and dividing by the count of non-transparent pixels:
function averageColor(
	gridData: Uint8ClampedArray,
	contrastFactor: number,
	saturationFactor: number,
) {
	let r = 0,
		g = 0,
		b = 0,
		a = 0;
	let count = 0;

	for (let i = 0; i < gridData.length; i += 4) {
		// Only include pixels with significant alpha (not transparent)
		if (gridData[i + 3] > 20) {
			r += gridData[i];
			g += gridData[i + 1];
			b += gridData[i + 2];
			a += gridData[i + 3];
			count++;
		}
	}

	if (count === 0) return { r: 0, g: 0, b: 0, a: 0 };

	return enhanceColor(
		r / count,
		g / count,
		b / count,
		a / count,
		contrastFactor,
		saturationFactor,
	);
}
Color Enhancement Logic
To make the dots “pop,” we apply contrast and saturation adjustments.
Contrast Enhancement:
$$C_{out} = \left( \left( \frac{C_{in}}{255} - 0.5 \right) \times f + 0.5 \right) \times 255$$Where \(f\) is the contrast factor.
Saturation Enhancement uses the luminance formula:
$$L = 0.3R + 0.59G + 0.11B$$$$C_{saturated} = C + s \times (C - L)$$Where \(s\) is the saturation factor and \(C\) is each color channel.
function enhanceColor(
	r: number,
	g: number,
	b: number,
	a: number,
	contrastFactor: number,
	saturationFactor: number,
) {
	const enhanceContrast = (value: number) => {
		return Math.max(
			0,
			Math.min(255, ((value / 255 - 0.5) * contrastFactor + 0.5) * 255),
		);
	};

	const enhanceSaturation = (r: number, g: number, b: number) => {
		const gray = 0.3 * r + 0.59 * g + 0.11 * b;
		return {
			r: Math.min(255, r + saturationFactor * (r - gray)),
			g: Math.min(255, g + saturationFactor * (g - gray)),
			b: Math.min(255, b + saturationFactor * (b - gray)),
		};
	};

	r = enhanceContrast(r);
	g = enhanceContrast(g);
	b = enhanceContrast(b);

	const saturated = enhanceSaturation(r, g, b);
	return {
		r: Math.floor(saturated.r),
		g: Math.floor(saturated.g),
		b: Math.floor(saturated.b),
		a: a,
	};
}
Drawing Circles
Finally, we render each circle using the Canvas 2D API:
const dotRadius = (gridSize - PadSize) / 2;
const circleColor = `rgba(${r}, ${g}, ${b}, ${a / 255})`;

processingCtx.fillStyle = circleColor;
processingCtx.beginPath();
processingCtx.arc(
	x + gridSize / 2,
	y + gridSize / 2,
	dotRadius,
	0,
	Math.PI * 2,
);
processingCtx.fill();
3. Building the User Interface
The UI is built around a “Reactive Canvas” pattern. Changes to the sliders immediately trigger a re-render of a preview canvas for instant feedback.
State Management
| State | Type | Description |
|---|---|---|
gridSize | number | The density of the dot matrix |
padSize | number | The spacing between individual dots |
exportQuality | number | Compression level for JPEG/WebP (0-100) |
useTransparentBg | boolean | Toggles between solid color or alpha channel |
backgroundColor | string | Hex color for the background |
Canvas References
We use useRef for three canvases:
const previewCanvasRef = useRef<HTMLCanvasElement | null>(null); // Shows original image
const processingCanvasRef = useRef<HTMLCanvasElement | null>(null); // Hidden, does processing
const dummyCanvasRef = useRef<HTMLCanvasElement | null>(null); // Live preview of settings
Drag and Drop Upload
const handleDrop = (event: React.DragEvent<HTMLDivElement>) => {
	event.preventDefault();
	setIsDragging(false);
	const file = event.dataTransfer.files?.[0];
	handleImageUpload(file);
};

const handleImageUpload = (file: File | null) => {
	if (file) {
		const reader = new FileReader();
		reader.onload = (e) => setImageSrc(e.target?.result as string);
		reader.readAsDataURL(file);
	}
};
4. Multi-Format Export
One of the key features of Dotify is the ability to export in both Raster and Vector formats.
Raster Formats (PNG, JPEG, WebP)
We generate all formats in parallel using canvas.toBlob():
const promises = ["png", "jpeg", "webp"].map(
	(format) =>
		new Promise<[ExportFormat, string]>((resolve) => {
			processingCanvas.toBlob(
				(blob) => {
					if (blob) {
						const processedUrl = URL.createObjectURL(blob);
						resolve([format as ExportFormat, processedUrl]);
					}
				},
				`image/${format}`,
				format === "png" ? undefined : exportQuality / 100,
			);
		}),
);

const results = await Promise.all(promises);
Vector (SVG) Generation
Unlike PNGs, SVGs allow the user to scale their dot matrix infinitely. We generate this by mapping our processed grid data to SVG <circle /> elements:
const generateSVG = (circles, width, height) => {
	let svg = `<svg xmlns="http://www.w3.org/2000/svg" width="${width}" height="${height}" viewBox="0 0 ${width} ${height}">`;

	if (!useTransparentBg) {
		svg += `<rect width="${width}" height="${height}" fill="${backgroundColor}" />`;
	}

	circles.forEach((c) => {
		svg += `<circle cx="${c.x}" cy="${c.y}" r="${c.r}" fill="${c.color}" />`;
	});

	return svg + `</svg>`;
};
5. Deployment
The application is optimized for Vercel’s Edge network. Using Next.js, static assets are delivered via CDN while the heavy lifting remains on the client-side via the Canvas API.
Steps to Deploy
- Push your code to GitHub:
git init
git add .
git commit -m "Initial commit"
git remote add origin <your-repo-url>
git push -u origin main
Go to vercel.com and sign in with GitHub
Click “New Project” and import your repository
Vercel auto-detects Next.js and configures the build settings
Click “Deploy” and your app is live at
your-project.vercel.app
Custom Domain (Optional)
In the Vercel dashboard:
- Go to your project settings
- Navigate to “Domains”
- Add your custom domain
- Update your DNS records as instructed
Conclusion
By combining the HTML5 Canvas API with modern React patterns, we’ve created a tool that is both performant and aesthetically pleasing. The project demonstrates that complex image manipulation doesn’t always require a heavy backend - sometimes, the browser’s native APIs are more than enough.
Links:
- Source Code: GitHub Repository
- Live Demo: dotify-client.vercel.app